

10 Minutes to Dataframe in Pandas
Learn and Become a Master of one of the most used Python tools for Data Analysis.


Introduction:-
Pandas is an open source, BSD-licensed library providing high-performance, easy-to-use data structures and data analysis tools for the Python programming language.
The Data Structures provided by Pandas are of two distinct types
1. Pandas DataFrames & .
2. Pandas Series
We’ll look at Pandas Dataframes in this post.
What is Data frames ?
A Data frame is a two-dimensional data structure, i.e., data is aligned in a tabular fashion in rows and columns.
A Data frame is a two-dimensional data structure, i.e., data is aligned in a tabular fashion in rows and columns. Pandas DataFrame consists of three principal components, the data, rows, and columns.
Features of DataFrame
- Potentially columns are of different types.
- Size — Mutable.
- Labeled axes (rows and columns).
- Can Perform Arithmetic operations on rows and columns.
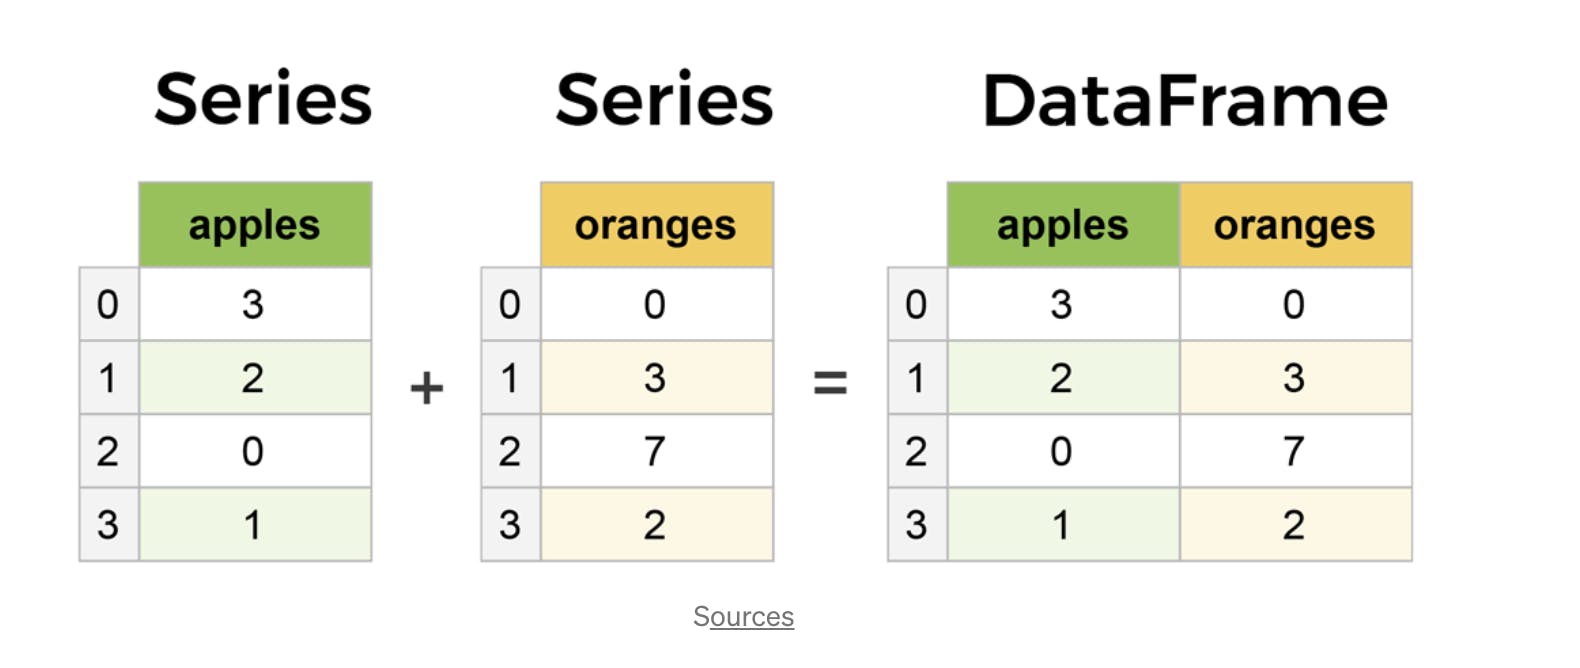
Diffrence between Series and DataFrame
You can think of it as an SQL table or a spreadsheet data representation.
How to Create a Dataframe ?
A pandas DataFrame can be created using the following constructor −
pandas.DataFrame( data, index, columns, dtype, copy)
The parameters of the constructor are as follows −
•Data : data takes various forms like ndarray, series, map, lists, dict, constants and also another data frame.
• index : For the row labels, the Index to be used for the resulting frame is Optional Default np.arange(n) if no index is passed.
• columns : For column labels, the optional default syntax is — np.arange(n).this is only true if no index is passed.
• dtype : Data type of each column.
• copy : This command (or whatever it is) is used for copying of data, if the default is False.
import pandas as pd
import numpy as np

df = pd.DataFrame()
print (df)
Reading the data and first insights
The first thing we should do, once we have downloaded or collected some data is to read such data into a pandas DataFrame.This is one of the main Pandas objects, along with the Series, and like I mentioned before, it resembles a table with columns and rows. Before, as always, we should import the library.
Pandas also has functions for reading from Excel sheets, HTML documents, or SQL databases(although there are other tools that are better for reading from databases)
import pandas as pd
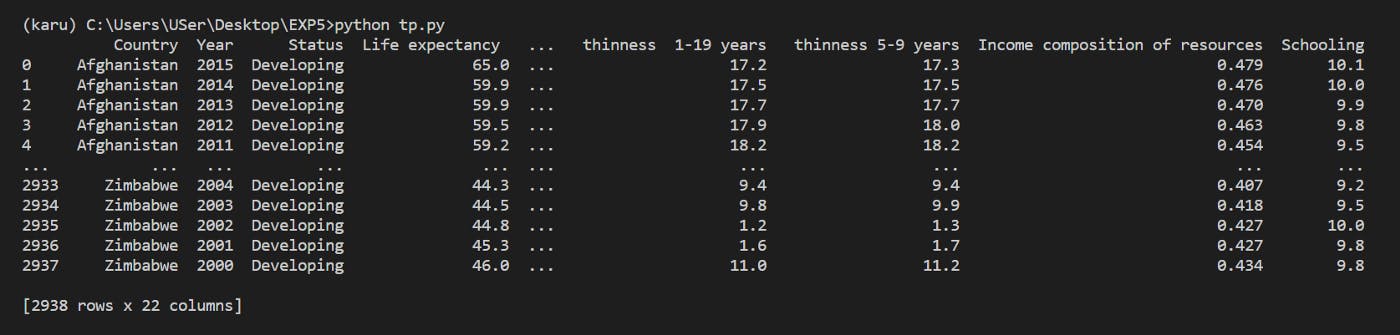
df = pd.read_csv("Life Expectancy Data.csv")
print(df)
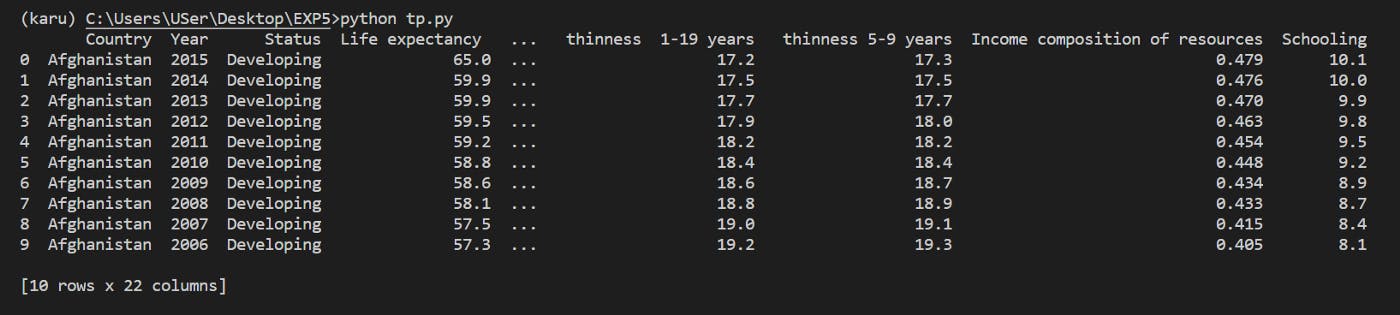
df.head()
We can check out the first n rows of our dataframe using the head method. There is also a tail method to look at the last n. By default if no n is given to these methods they return the first 5 or last 5 instances.
import pandas as pd
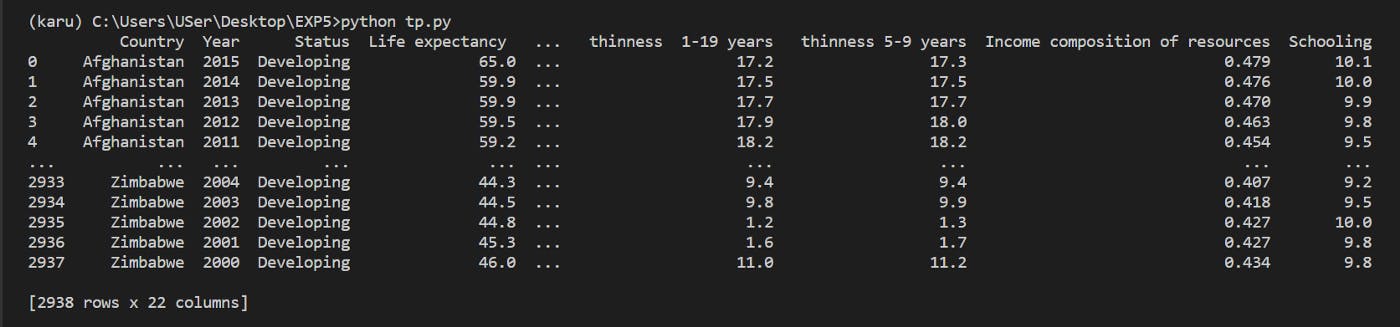
df = pd.read_csv("Life Expectancy Data.csv")
print(df)
df.head()
Using the head method without a parameter returns the following block:
After successfully reading our data and creating our dataframe, we can start getting some information out of it with two simple methods:
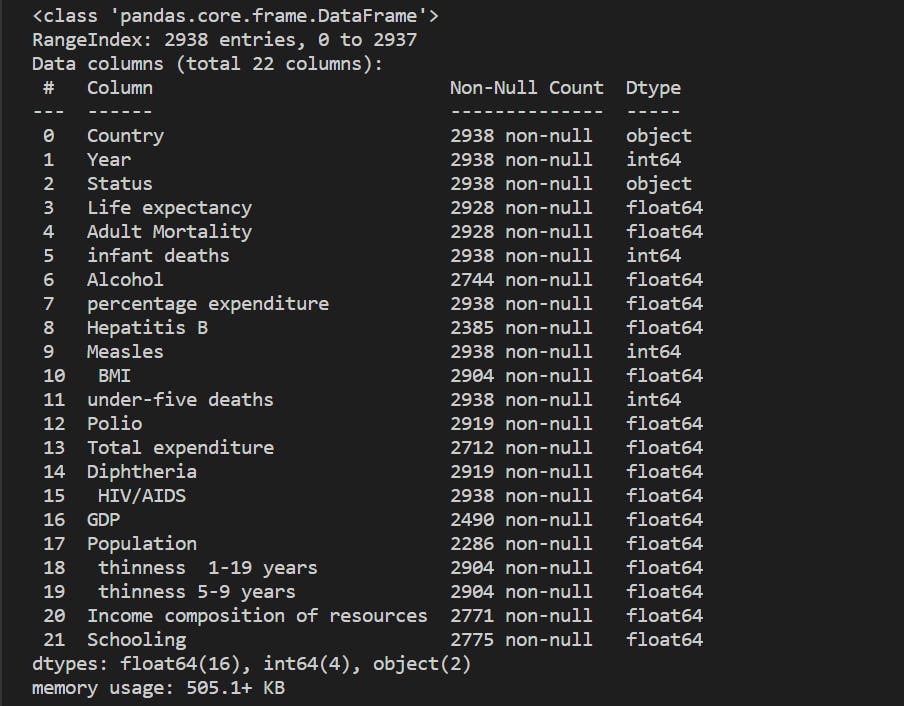
- info: the info method returns the number of rows in the dataframe, the number of columns, the name of each column of the dataframe along with the number of non-null values of such column, and the data type of each column.
import pandas as pd

df = pd.read_csv("Life Expectancy Data.csv")
print(df)
df.info()
2.describe: the describe method returns some useful statistics about the numeric data in the dataframe, like the mean, standard deviation, maximum and minimum values, and some percentiles.
import pandas as pd

df = pd.read_csv("Life Expectancy Data.csv")
print(df)
df.describe()
The next step after getting this global view of our data is learning how to access specific records of our dataframe. Like a python list, pandas dataframes can be sliced, using exactly the same notation as for the lists.
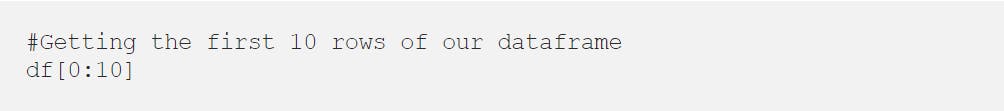
So if we want to select the first 10 rows of our dataframe, we could do something like:
Indexing and selecting data
With loc and iloc you can do practically any data selection operation on DataFrames you can think of -
• loc is label-based, which means that you have to specify rows and columns based on their row and column labels.
• iloc is integer index based, so you have to specify rows and columns by their integer index. After successfully understanding theory behind the loc and iloc, Let’s get started to implement it.
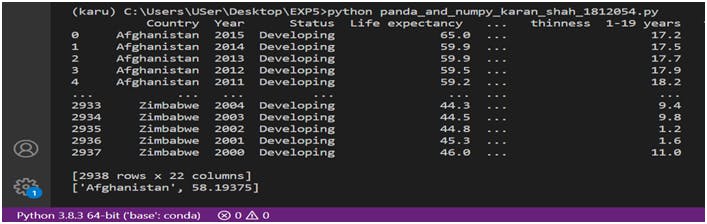
1. Average Life Expectancy over 15 Years in Afghanistan.
import pandas as pd

df = pd.read_csv("Life Expectancy.csv")
print(df)
country=df['Country'][1]
df = df.loc[df['Country'] == 'Afghanistan']
life_expectancy = df['Life expectancy '].mean()   # name of the column data where avg to be performed
final_answer = [country, life_expectancy]
print(final_answer)
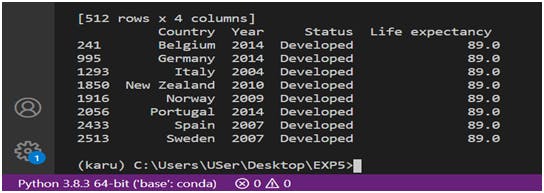
2. Highest Life Expectancy in Developed Country over 15 years
import pandas as pd

df = pd.read_csv("Life Expectancy.csv")
print(df)
ck = df.loc[df['Status'] == 'Developed']
finalAnswer = ck.loc[ck['Life expectancy '].max() == ck['Life expectancy ']]
print(finalAnswer)
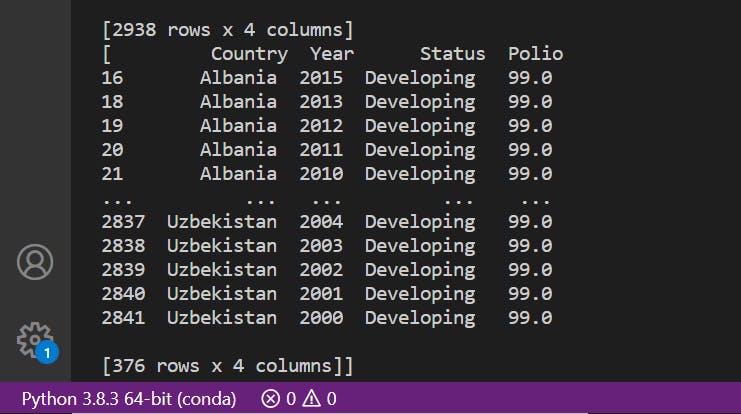
3. Maximum polio in the countries over 15 years.
import pandas as pd
import numpy as np

df = pd.read_csv(r'C:\Users\USer\Desktop\program\python\EXP5\Life Expectancy Data.csv',usecols = ['Country','Year','Status','Polio'])
print(df)
x=df[df.Polio == df.Polio.max()]
final_answer = [x]
print(final_answer)
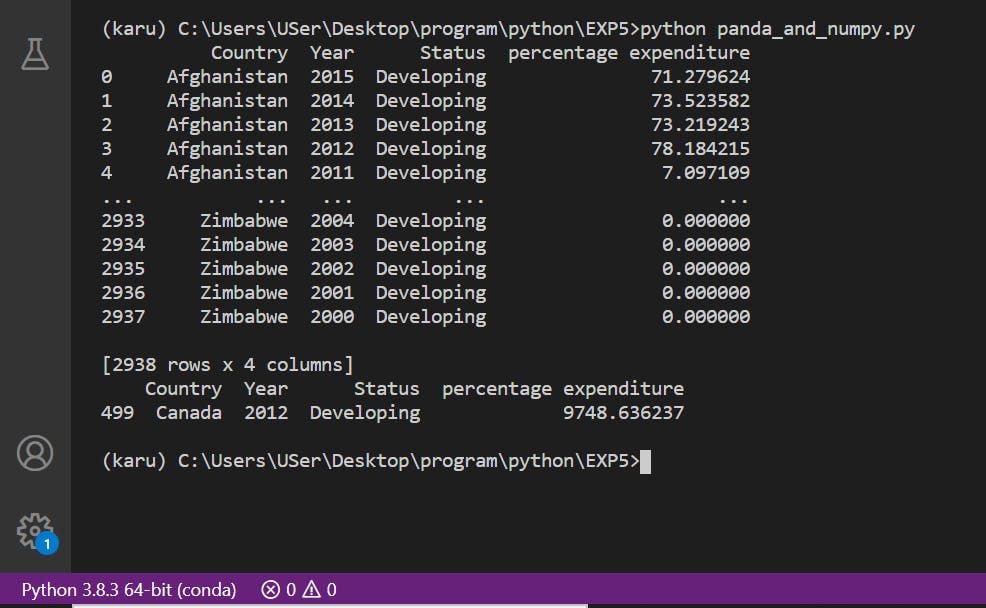
4. Maximum percentage expenditure of the Developing country over 15years.
import pandas as pd
import numpy as np


df = pd.read_csv(r'C:\Users\USer\Desktop\program\python\EXP5\Life Expectancy Data.csv',usecols = ['Country','Year','Status','percentage expenditure'])
print(df)
ck = df.loc[df['Status'] == 'Developing']
finalAnswer = ck.loc[ck['percentage expenditure'].max() == ck['percentage expenditure']]
print(finalAnswer)
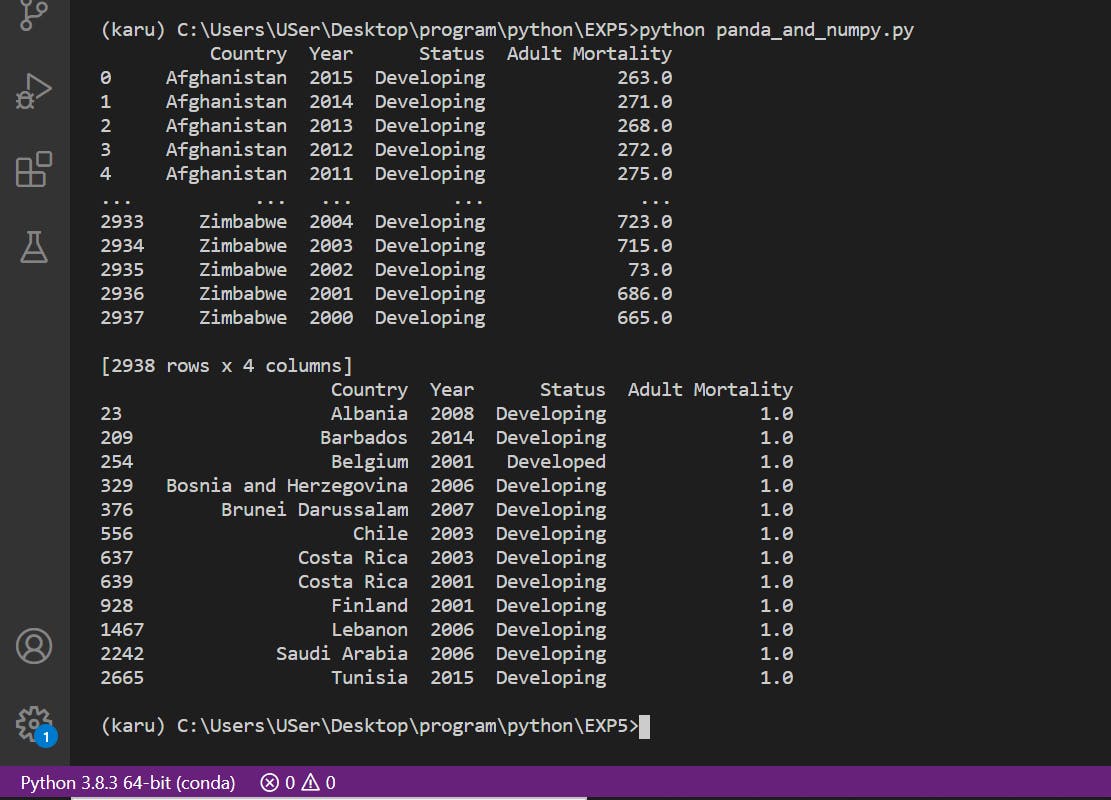
5. Lowest Adult Mortality in a particular country over 15 years.
import pandas as pd
import numpy as np


df = pd.read_csv(r'C:\Users\USer\Desktop\program\python\EXP5\Life Expectancy Data.csv',usecols = ['Country','Year','Status','Adult Mortality'])
print(df)
finalAnswer= df.loc[df['Adult Mortality'].min() == df['Adult Mortality']]
print(finalAnswer)
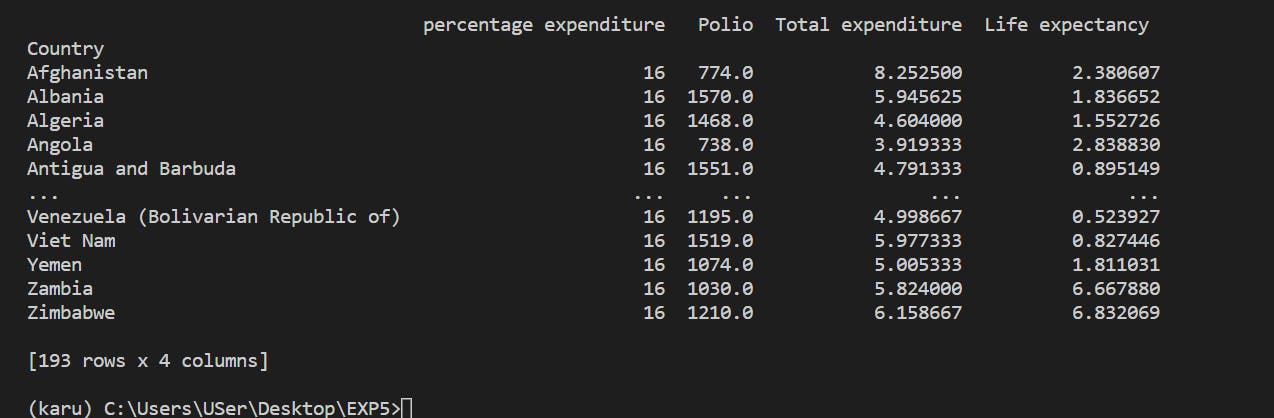
Any groupby operation involves one of the following operations on the original object. They are −
• Splitting the Object
• Applying a function
• Combining the results
6. Showing data of all Country having avg total expenditure, sum of polio and standard deviation of life expectancy with the method called groupby
import pandas as pd

df = pd.read_csv("Life Expectancy.csv")
print(df)
ans=df.groupby('Country').agg({'percentage expenditure':'size','Polio':'sum','Total expenditure':'mean','Life expectancy ':'std'})
print(ans)
We have seen what Pandas is, and some of its most basic uses. In the following posts we will see more complex functionalities and dig deeper into the workings of this fantastic library!
That is all, I hope you liked the post. Feel Free to follow me.